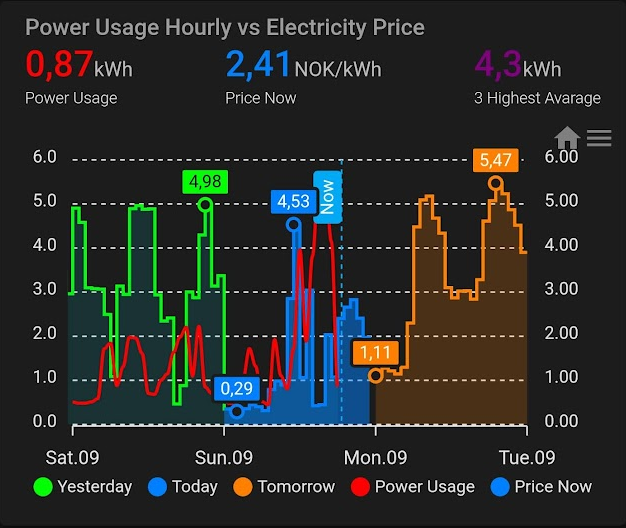
I wanted to see my Power Consumption together with Electricity Price in a nice graphical representation.
For that, I used ApexCharts-Card: https://github.com/RomRider/apexcharts-card
The graph uses data from Tibber, Tibber Data, and Nordpool integrations.
- Tibber: https://www.home-assistant.io/integrations/tibber/
- Tibber Data: https://github.com/Danielhiversen/home_assistant_tibber_data
- Nordpool: https://github.com/custom-components/nordpool
The result is shown in the image, and the code can be downloaded here:
type: custom:apexcharts-card
header:
show: true
title: Power Usage Hourly vs Electricity Price
show_states: true
colorize_states: true
now:
show: true
label: Now
graph_span: 72h
span:
start: day
offset: '-24h'
apex_config:
xaxis:
labels:
format: dd.MM
chart:
zoom:
enabled: true
toolbar:
show: true
tools:
zoom: true
zoomin: false
zoomout: false
pan: false
reset: true
tooltip:
fixed:
enabled: true
position: bottomLeft
yaxis:
- id: first
apex_config:
min: 0
opposite: true
forceNiceScale: true
decimalsInFloat: 2
labels:
show: true
- id: second
apex_config:
opposite: false
forceNiceScale: true
decimalsInFloat: 1
labels:
show: true
all_series_config:
stroke_width: 4
series:
- entity: sensor.nordpool_kwh_oslo_nok_3_10_025
yaxis_id: first
name: Yesterday
type: area
curve: stepline
float_precision: 2
stroke_width: 2
opacity: 0.05
extend_to: false
offset: '-1min'
show:
in_header: false
legend_value: false
in_chart: true
extremas: true
offset_in_name: false
color: '#00FF00'
- entity: sensor.nordpool_kwh_oslo_nok_3_10_025
yaxis_id: first
name: Today
type: area
curve: stepline
float_precision: 2
stroke_width: 2
opacity: 0.5
extend_to: false
offset: '-1min'
show:
in_header: false
legend_value: false
extremas: true
offset_in_name: false
color: '#0080FF'
data_generator: |
return entity.attributes.raw_today.map((p) => {
return [new Date(p.start), p.value];
});
- entity: sensor.nordpool_kwh_oslo_nok_3_10_025
yaxis_id: first
name: Tomorrow
type: area
curve: stepline
float_precision: 2
stroke_width: 2
opacity: 0.2
offset: '-1min'
show:
in_header: false
legend_value: false
extremas: true
offset_in_name: false
color: '#FF7F00'
data_generator: |
return entity.attributes.raw_tomorrow.map((p) => {
return [new Date(p.start), p.value];
});
- entity: sensor.accumulated_consumption_current_hour
yaxis_id: second
name: Power Usage
type: line
float_precision: 2
stroke_width: 2
opacity: 1
color: '#FF0000'
extend_to: false
show:
in_header: true
legend_value: false
group_by:
func: max
- entity: sensor.nordpool_kwh_oslo_nok_3_10_025
yaxis_id: first
name: Price Now
type: area
curve: stepline
float_precision: 2
stroke_width: 0
opacity: 0.1
extend_to: false
show:
in_header: true
legend_value: false
in_chart: true
color: '#0080FF'
- entity: sensor.average_of_3_highest_hourly_consumption
yaxis_id: second
name: 3 Highest Avarage
type: line
float_precision: 2
stroke_width: 2
opacity: 1
color: '#800080'
extend_to: false
show:
in_header: true
legend_value: false
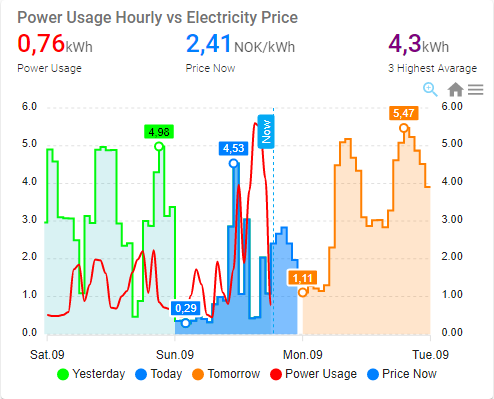
in_chart: falseBelow is a screenshot from my phone in Light Mode.
I have 3 template sensors to find the cheapest hours:
- Cheapest 3 hours
- Cheapest 4 hours
- Cheapest 6 hours
The code below should be placed in sensors.yaml.
- platform: template
  sensors:
    cheapest_3_hours:
      value_template: >-
        {% set l=state_attr('sensor.nordpool_kwh_no1_nok_3_10_025', 'raw_today')|sort(attribute='value') %}
        {{ (now() >= l[0].start and now() <= l[0].end)
          or (now() >= l[1].start and now() <= l[1].end)
          or (now() >= l[2].start and now() <= l[2].end) }}

- platform: template
  sensors:
    cheapest_4_hours:
      value_template: >-
        {% set l=state_attr('sensor.nordpool_kwh_no1_nok_3_10_025', 'raw_today')|sort(attribute='value') %}
        {{ (now() >= l[0].start and now() <= l[0].end)
          or (now() >= l[1].start and now() <= l[1].end)
          or (now() >= l[2].start and now() <= l[2].end)
          or (now() >= l[3].start and now() <= l[3].end) }}

- platform: template
  sensors:
    cheapest_6_hours:
      value_template: >-
        {% set l=state_attr('sensor.nordpool_kwh_no1_nok_3_10_025', 'raw_today')|sort(attribute='value') %}
        {{ (now() >= l[0].start and now() <= l[0].end)
          or (now() >= l[1].start and now() <= l[1].end)
          or (now() >= l[2].start and now() <= l[2].end)
          or (now() >= l[3].start and now() <= l[3].end)
          or (now() >= l[4].start and now() <= l[4].end)
          or (now() >= l[5].start and now() <= l[5].end) }}
Hei Martin!
Først og fremst, kjempeflott fremstilling, og ikke minst supert at du deler.
Kan du dog dele template sensorene og? Det er lettere å følge guiden om man trinn for trinn skaper de dependencies som er en forutsetning for å bruke guiden og få til samme resultat 🙂